

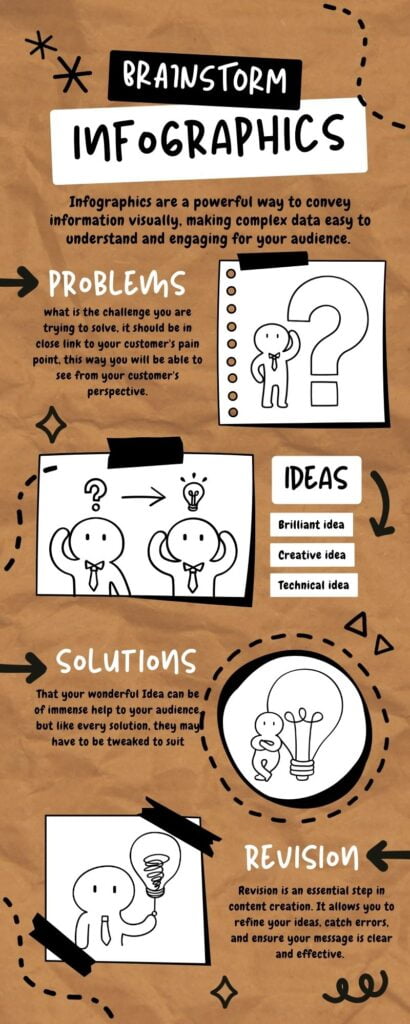
Infographics are a powerful way to convey information visually, making complex data easy to understand and engaging for your audience. Whether you’re a marketer, educator, or simply someone looking to share information effectively, creating engaging infographics can be a valuable skill. In this step-by-step tutorial, we’ll guide you through the process of designing compelling infographics that captivate and inform.
Step 1: Define Your Purpose and Audience
Before diving into the design, it’s crucial to clarify the purpose of your infographic and identify your target audience. What message do you want to convey, and who do you want to reach? This initial step sets the foundation for your design choices.
Step 2: Gather Data and Content
Collect the data and content you intend to include in your infographic. This can be statistics, facts, or any information relevant to your topic. Make sure your information is accurate and well-researched.
Step 3: Choose the Right Layout
Decide on the layout of your infographic. Common options include vertical, horizontal, or square formats. Consider what will work best for your content and audience.
Step 4: Design the Visual Hierarchy
Establish a clear visual hierarchy for your infographic. Highlight key points with larger text, bolder colors, and distinctive graphics. This hierarchy will guide the viewer’s eye through the content.
Step 5: Select an Eye-Catching Color Scheme
Choose a colour scheme that aligns with your message and appeals to your audience. Ensure that the colors are complementary and harmonious. Use color strategically to create contrast and draw attention.
Step 6: Typography Matters
Select fonts that are easy to read and complement your design. Use a maximum of two or three fonts for consistency. Make sure the text is legible, and use various font sizes to indicate importance.
Step 7: Create Engaging Graphics
Incorporate icons, illustrations, and charts to make your data visually appealing. Icons can represent concepts, illustrations can add context, and charts can simplify complex information.
We can help you create Stunning graphics Click here now
Step 8: Keep It Simple
Avoid clutter and excessive details. Infographics should be concise and to the point. Remove any unnecessary elements that do not contribute to the message.
Step 9: Add a Compelling Title
Craft a compelling and descriptive title that grabs the viewer’s attention and conveys the main idea of your infographic.
Step 10: Balance Text and Visuals
Maintain a balance between text and visuals. Use text to explain, support, and provide context for the graphics. Ensure that both elements work together harmoniously.
Step 11: Test and Refine
Before finalizing your infographic, review it for clarity, accuracy, and visual appeal. Ask for feedback from peers to make necessary improvements.
Step 12: Export and Share
Once you’re satisfied with your infographic, export it in a suitable format (e.g., PNG, JPEG, or PDF). Share it on your website, social media, or in presentations to reach your target audience.
Learn how to desing now even if you are an absolute beginer Enrol for Graphics Design Class
Creating engaging infographics requires a combination of creativity, data analysis, and design skills. By following these steps, you can effectively communicate your message and captivate your audience with visually compelling content. Infographics are a valuable tool for storytelling, education, and marketing, and with practice, you can become a proficient infographic designer.